I was thinking about how to help with Bisq’s growth and one thing that stood out to me was that we could provide traders with more statistics about the busy hours to trade.
Bisq provides a specific “place” to trade but not exactly a specific “time”. I think that if we could provide this data to both offer makers and takers there’d be more synchronization between both.
After fetching some of the trading data through https://markets.bisq.network/api/#trades (thank you @m52go) I created this google sheets doc with trades from the BRL and EUR markets, just as a test.
bisq-trades-2019 - Google Tabellen

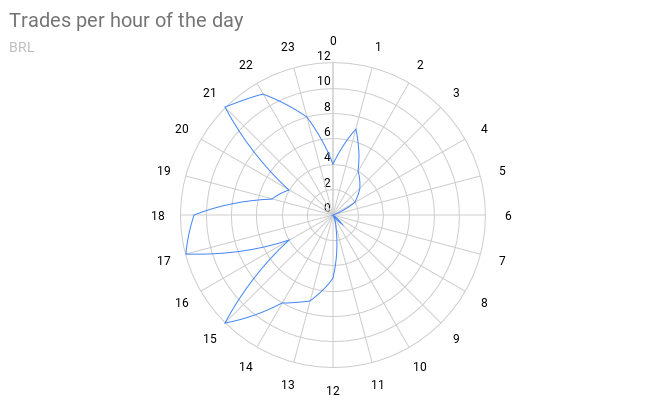
From that data I could create a chart above showing the distribution of trades of the BRL marke. As to be expected there’s a great disparity in the distribution of trades throughout the day.
It could be very helpful if we were to advertise the hours to expect more trades. This would lessen the load on offer makers to have their Bisq clients running 24/7 and would help offer takers to know when to expect fuller markets. More than that, through sharing this information we could influence an aggregation of trades.
I’m not technical enough to fetch all the trading data and properly process it so I got only the last 123 trades from the BRL (it’s a new market) and the last 2000 EUR markets. I took as much as the API would allow. Maybe it’d be interesting to study the data in more detail (type of offer, payment method) but I think current charts I have on the document are good to begin with.